The Binomial Sequential Sampling Plan for pea aphids on dry peas is designed to quickly designate a pea aphid infestation as economic or non-economic.
Derivation of binomial sequential decision plans began from the formulas of Waters (1955) for the binomial distribution. Critical pest densities (M1 and M2) were adopted from the economic injury levels in our EIL calculator by designating the lower limit of an economic infestation (M2) as 3 aphids per plant and by assigning the upper limit of a non-economic infestation (M1) as 1 aphid per plant. The value for M2 was selected because it conservatively recommends control action at the smallest economic injury level for current production and market conditions, while the M1 value was arbitrarily designated as 1/3 the value of M2. The Nachman model restates these critical densities as 58% aphid-infested plants (i.e. M2, Pi = 0.58) and 30% aphid-infested plants (i.e. M1, Pi = 0.30), respectively. Because commercial pea producers typically consider failure to treat an economic infestation (designated by parameter beta) more serious than mistakenly treating a noneconomic population (designated by parameter alpha), error levels alpha and beta were not assigned the same value but instead were specified as 0.01 and 0.001, respectively.
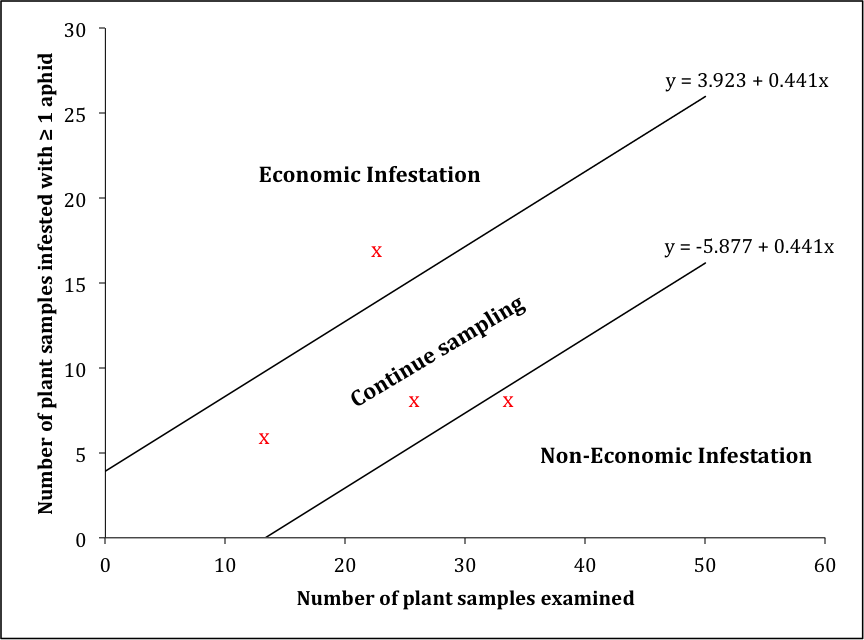
Substitution of these values into the formulas of Waters (1955) gives the lower and upper classification lines for the binomial sequential decision plan as -5.877 + 0.441x and 3.923 + 0.441x, respectively, where x is the number of plants inspected. Depicted in tabular format for ease-of-use in the field, the decision plan requires at least 14 consecutive plant inspections without detection of pea aphids before one can classify a field as non-economic and a minimum of 8 consecutive plant inspections positive for pea aphids to classify as economic. This asymmetry in minimum sample size reflects the assignment of differing values for alpha and beta error rates.
Because sequential sampling theoretically can continue indefinitely if actual pest density falls between M1 and M2, it is necessary to identify a pragmatic maximum sample size for field use of the decision plan. The maximum sample size is defined by Nmax = s2/E2x2 (Southwood and Henderson 2000), where s2 is sampling variance, x is mean density and E is desired sampling precision expressed by the standard error (SE) stated as a proportion of mean density. The value Nmax was computed for 25% desired precision (E = 0.25) using sample mean and variance from the sole 3 dates during 2011 and 1 date during 2012 when observed aphid density was between the two class limits. Nmax ranged from 32-to-95 plants with a mean of 72 plants required for 25% precision. For simplicity and practicality the maximum sample size was limited to 50 samples for the sequential decision plan.
Sequential decision plans were generated from the formulas for the binomial distribution given by Waters (1955) for Wald's (1945) sequential probability ratio test. Performance was analyzed by simulated field sampling using nine of the twenty-seven 2011 data sets: three dates on which observed aphid density exceeded the lower limit of an economic infestation, three dates on which observed aphid density was less the upper limit of a non-economic infestation, and three dates on which observed aphid density fell between those limits. In addition to using data sets from 2011, we also simulated six data sets from six different locations across the Palouse during 2012. Using Quantum GIS 1.8.0 'Lisboa' these six locations were plotted and estimated to cover an approximate area of 940.35 Km2 (363.07 miles2).
Simulated non-replacement sampling involved drawing random plants each date and tabulating them against the stop lines of the sequential decision plan until either the plan categorized a pest status or until a maximum of 50 plants had been selected. Average sample size and the frequency of correct control decisions were computed after 100 simulated sampling runs from each of the 15 data sets using Microsoft Excel 2010.
Validation by simulated sampling suggests the binomial sequential decision plan will perform best when pest density is far below or above the economic injury level. In particular, resampling from the eight data sets where actual pest density was no more than 36% of the economic injury level correctly classified sites as non-economic each of the 800 simulated sampling runs at a mean sample size of 16.7 plants. At the other infestation extreme, resampling from the three data sets where actual field density exceeded the economic injury level correctly classified sites 98% of the time (294 of 300). One of those three data sets (Kambitsch 28 Jul) entirely accounted for the 2% errors: 1% (3 cases in 100 runs) was misclassified as non-economic and the other 1% (3 cases in 100 runs) could not be classified within the 50-sample limit. Inadequate fit of the Nachman model contributed to those decision plan errors; actual aphid density of 5.7 aphids per plant at that site exceeded the absolute economic injury level of 3.0 aphids per plant, but the observed field frequency of 65% infested plants was substantially less than the 77% predicted value.
References cited
Wald, A. 1945. Sequential tests of statistical hypotheses. Ann. Math. Stat. 18:117-188.
Waters, W. E. 1955. Sequential sampling in forest insect surveys. For. Sci. 1:68- 79.