This calculator is designed to estimate the pea aphid density (aphids per plant) at which a control action should be taken in order for the producer to break-even on their investment of a control action (purchasing and applying insecticide). This break-even point is called the Economic Injury Level (EIL). The EIL can be calculated using Pedigo et al. (1986) widely used and accepted formula:
EIL = C/(VYpDK)
The Economic Threshold is the pest density at which control measures should be determined (initiated) to prevent an increasing pest population from reaching the EIL. The ET is almost always below the EIL.
How the Calculator Works
Inputs
C = Control cost, the cost of purchasing and applying the control action (insecticide), expressed as dollar amount per acre ($/acre).
V = Market value, the market value of peas (or lentils) or the contracted price per hundred-weight, expressed as the dollar amount per hundred-weight ($/cwt).
Yp = Yield potential, the maximum yield per production unit, expressed as hundred-weight per acre (cwt/acre), historical values are typically used for this expression.
K = Insecticide efficacy, the efficacy of any insecticide is the proportion of the pest population killed, it can range from 0 to 1 (typically it is expressed as 1, meaning 100% of the pest population is killed).
D = Damage per aphid, expressed as a percentage of crop yield loss per aphid during the start of flowering.
FOR PEAS:
The D variable in our equation was produced using field-based scientific experiments using 'Aragorn' peas and non-viruliferous (virus-free) aphids from the Manis University of Idaho Insectary Colony. Known numbers of aphids were placed within known numbers of caged pea plants during the 2009 & 2010 growing seasons and the population was monitored from the start of flowering through senescence (Stokes unpublished). In order to get a percent of crop yield loss, yield was re-expressed as a proportion of the highest yielding control plot (with the fewest number of aphids, 0 in this case) and plotted against realized aphids 3 days < 100 aphids per plant after the beginning of the experiment.
The best-fit model to our data was the curvilinear model:
PEAS: y = 0.7289*exp(-0.0169x)
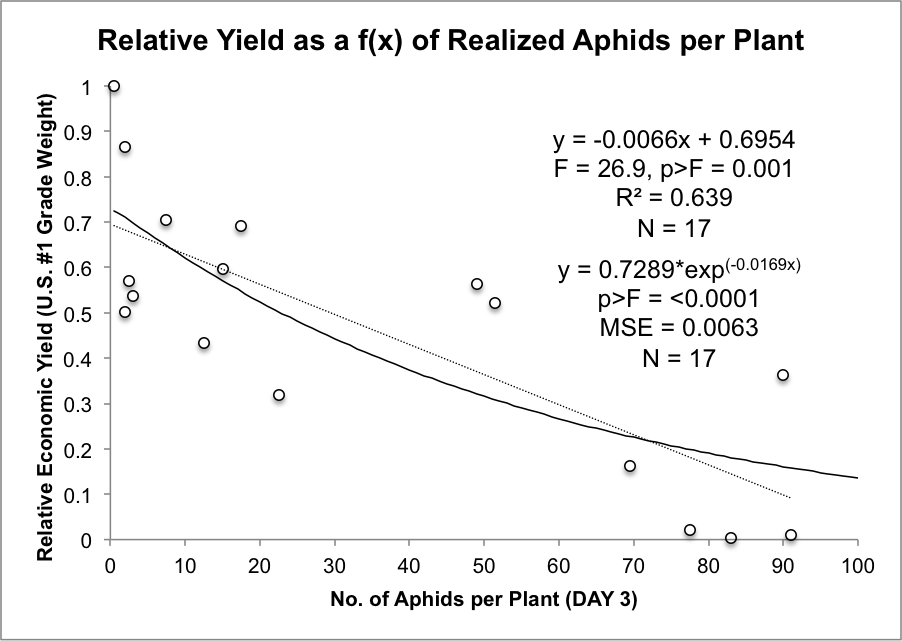
where y is relative economic yield and x is aphid density per plant 3-days after initial encagement. This model further reduced variation in predicted yield and so was adopted as the basis for computing EILs.
Given the curvilinear model parameters a = 0.7289 and b = -0.0169 from the best-fit model, we computed EIL values using the following modified EIL equation:
EIL = (1/b)ln[1-(C/(VKYpa))]
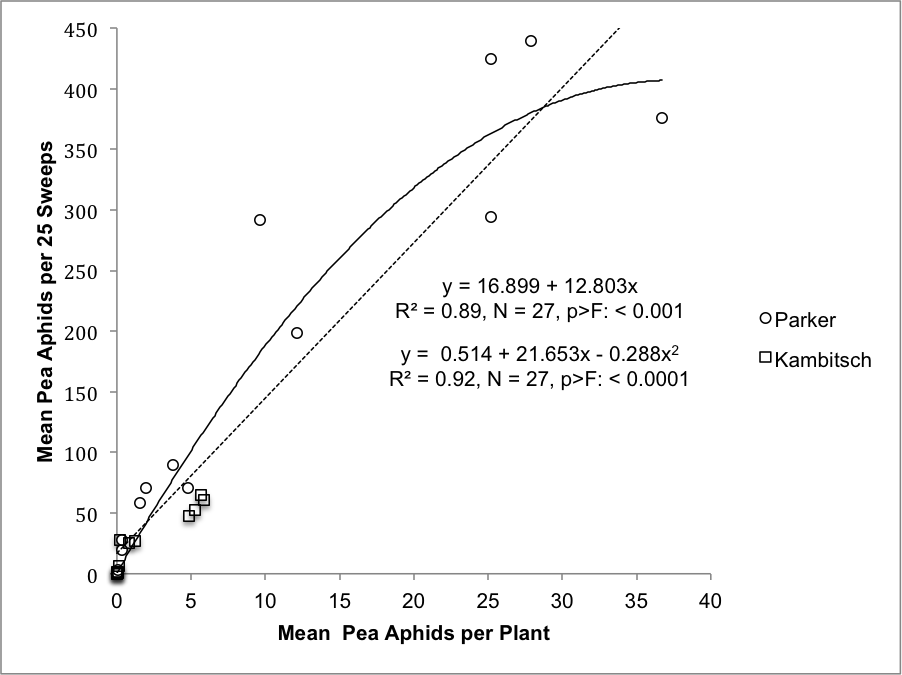
EIL values (expressed as aphids per plant) were then transformed using the quadratic model derived from mean aphid counts per plant and mean aphids per 25 - 180° sweeps:
y = 0.514 + 21.653x - 0.288x2
FOR LENTILS:
The D variable in our equation was produced using field-based scientific experiments using 'Brewer' lentils and non-viruliferous (virus-free) aphids from the Manis University of Idaho Insectary Colony. Known numbers of aphids were placed within known numbers of caged lentil plants during the 2011 & 2012 growing seasons and the population was monitored from the start of flowering through senescence (Paudel unpublished). In order to get a percent of crop yield loss, yield was re-expressed as a proportion of the highest yielding control plot (with the fewest number of aphids, 0 in this case) and plotted against realized aphids 5 days after the beginning of the experiment.
The best-fit model to our data was the curvilinear model:
LENTILS: y = 0.89*exp(-0.0056x)
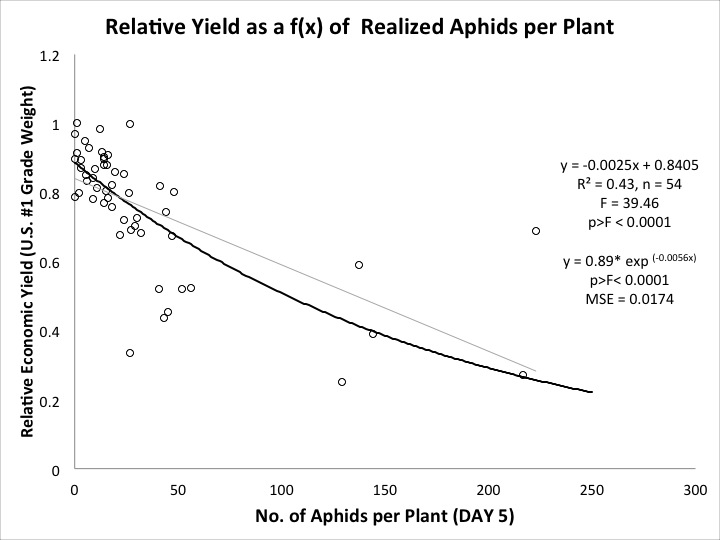
where y is relative economic yield and x is aphid density per plant 5-days after initial encagement. This model further reduced variation in predicted yield and so was adopted as the basis for computing EILs.
Given the curvilinear model parameters a = 0.89 and b = -0.0056 from the best-fit model, we computed EIL values using the following modified EIL equation:
EIL = (1/b)ln[1-(C/(VKYpa))]
Assumptions and Limitations
For PEAS:
- Our controlled field plot studies used the variety 'Aragorn' and were conducted 2 miles East of Moscow, Idaho at the University of Idaho Parker Farm in 2009 & 2010. Different growing conditions and varieties will likely produce slightly different results than those produced by this EIL calculator.
- Plots were caged with no-see-um netting as to prevent immigration or emigration of pea aphids or potential natural enemies. Therefore, if natural enemies are present in the field (and in high numbers) our EIL estimates may be slightly too high.
- This calculator is scientifically viable only for the reproductive growth stage of 'Aragorn' pea plants, i.e. from the start of flowering through senescence. If a different variety is planted/used or, if this calculator is used at a different growth stage it will likely produce different results.
- ONLY non-viruliferous (virus-free) aphids were used in this study and therefore if viruliferous aphids are present they may produce slightly different results than this calculator.
For LENTILS:
- Our controlled field plot studies used the variety 'Brewer' and were conducted 2 miles East of Moscow, Idaho at the University of Idaho Parker Farm in 2011 & 2012. Different growing conditions and varieties will likely produce slightly different results than those produced by this EIL calculator.
- Plots were caged with no-see-um netting as to prevent immigration or emigration of pea aphids or potential natural enemies. Therefore, if natural enemies are present in the field (and in high numbers) our EIL estimates may be slightly too high.
- This calculator is scientifically viable only for the reproductive growth stage of 'Brewer' lentil plants, i.e. from the start of flowering through senescence. If a different variety is planted/used or, if this calculator is used at a different growth stage it will likely produce different results.
- ONLY non-viruliferous (virus-free) aphids were used in this study and therefore if viruliferous aphids are present they may produce slightly different results than this calculator.